SQL Server Performance Monitoring and bottleneck detection
SQL Server Performance Audit
The following report can be run on the Patriot SQL Server to monitor performance. Windows provides a built-in Performance Monitor that can be used to check on key system statistics over a period of time. By monitoring these counters over a typical 24 hour period of use, it is often possible to identify key areas that may need improvement or reconfiguration. Repeating these reports on a quarterly basis can help track performance trends over time. In addition, it is also recommended to consult the Hardware Requirements document for hardware and configuration guidelines.
Running Performance Monitor
To start performance monitor, open the Windows Control Panel, Administrative Tools, and select Performance (the exact name depends on the windows version being used).
Remove the default counters if they are not applicable, and then select the + button to add the required counters. A list of counters to examine is provided below.
The default monitoring window of Performance monitor will only show very recent data. To fix this, open the properties of the performance monitor and change the duration and sample interval on the General tab. Generally, a sample interval of 120 seconds (2 minutes) and a total duration of 86400 seconds (24 hours) should provide an overview of the performance throughout the day.
Logging Data Collection
In addition to viewing the data on the screen, it is also recommended to create a log file using Data Collector Sets. To do this, expand Data Collector Sets, then right-click on User Data Sets and select New > Data Set.
Enter the name, and select to create manually. On the next tab, select to create logs, and check performance counters is enabled. On the next tab, add the counters required, and set the sample interval to a reasonable value (e.g. 15-30 seconds). Select the log directory, then choose the 'Open Properties' option and finish.
In the properties screen, select the stop condition tab and enable the 'stop after overall duration' option. Set the duration to 1 day to ensure that the log does not grow too large.
The collector can then be started by right-clicking it and selecting the Start option. It will run for the configured 24 hours and record its data into the log file specified.
Logging can be run in addition to, or instead of, the interactive logging graph above. Running in log mode is more efficient, has less impact on the server, and allows more frequent sampling, so this is the recommended approach.
Viewing and interpreting results
If logging was enabled, ensure the collector set is stopped (right-click) then right-click again and select 'View Latest Report'.
The collected data will be displayed as a graph with minimum, average and maximum figures shown. Record these in the report tables at the end of the document and check the values against the details for that counter. In addition, the graph should be checked for any spikes that may have occurred during certain times. These spikes may not show up clearly in min/max/average figures, so the graph itself is also a useful tool.
The report and log files can also be sent to Patriot support for analysis help.
Patriot would appreciate a copy of the data for our records, as this helps us identify common performance problems and focus future development.
Useful Counters to Monitor
Please consult the report at the end of this document for a list of counters to add to the performance monitor. A brief explanation of the counters in each category is included below to help with analysis after the report is completed.
Counters to examine memory performance and pressure
The following counters are available to help diagnose problems with system memory.
Memory - Available Bytes:
This represents the amount of free memory in the system. If this is consistently very low, then it may indicate that the system is under memory pressure. Using the default SQL Server configuration, SQL will attempt to dynamically make use of most of the free memory in the system, automatically releasing it if the memory is needed elsewhere. If this value remains low for a long period of time without SQL releasing memory (see Private Bytes), then there may not be enough RAM in the system.
Memory - Pages/sec:
This represents the number of times that a memory request had to be loaded from the hard disk instead of from memory. Ideally this should be 0, with occasional spikes perfectly normal. An average value of between 1 and 20 is average, and anything over 50 is usually a cause for concern. If this value is consistently high, then the physical memory is unable to meet demand and the OS is having to use the disk for additional storage.
SQL Server: Buffer Manager - Buffer cache hit ratio:
This value indicates which percentage of data requests could be answered using the SQL buffer cache (memory). It is common for this value to meet or exceed 99%. If this value is low, then requests are being loaded from disk, which reduces performance. Either SQL is still warming up, or the memory requirements of the cache are too high for the configured/available values. Configure SQL to allow more memory, or add more memory to the system.
SQL Server: Buffer Manager - Page Life Expectancy:
This value indicates how long data can remain in the SQL data buffer without being used before it is removed. A low value for this counter indicates that there is a lot of turnover in the buffer, reducing the cache effectiveness and possibly indicating memory pressure. A normal value to see here is 300 or more.
SQL Server: Memory Manager - Memory Grants Pending:
This counter shows the number of processes waiting for memory within SQL Server. Under normal conditions, this value should be consistently 0, If this value is high, SQL does not have enough memory available to it.
SQL Server: Memory Manager - Target Server Memory:
This indicates the total amount of memory that SQL server is willing and able to use. Compare this with Total Server Memory to see if SQL is able to make use of its ideal amount of memory.
SQL Server: Memory Manager - Total Server Memory:
This indicates the total amount of memory that SQL server is currently using/assigned. If the Total memory is significantly lower than the Target memory, then there may be not enough memory available, SQL may be still warming up, or the load may be light on the server. Check if Free Pages is > 5000 to see if the system is simply under low load and not requiring the full amount of memory.
Counters to examine Disk and I/O performance and pressure
The following counters are available to help diagnose problems with the physical disk and I/O systems.
For each Physical disk in the system, repeat the counters to identify if problems are isolated to specific disks.
Physical Disk: % Disk Time:
This counter records the percentage of time that the disk was busy with read/write operations. This value should not be consistently high. If this value is consistently above 85%, then an I/O bottleneck is occurring. As the disk is much slower than the main memory, it is beneficial to reduce this as much as possible, either by upgrading the disk system or adding additional memory.
Physical Disk: Avg Disk sec/read and Physical Disk: Avg Disk sec/write:
This records the average amount of time it takes to read/write data from the disk. If the average value is above 10ms, then the disk is taking too long to read/write data. The hardware/configuration will need to be reviewed to improve this value. For the transaction log drives, this value is especially important.
Physical Disk: Avg. Disk Queue Length and Physical Disk: Current Disk Queue Length:
This records the number of outstanding requests to read/write to the disk. If this value is consistently higher than 2 (2 per disk for RAID arrays), then the disk/array is unable to keep up with I/O requests.
Physical Disk - Disk Bytes/sec:
This counter monitors the rate of data being transferred to/from the disk. If this exceeds the rate capacity of the physical disk, then the data will begin to backlog, as indicated in Disk Queue Length.
Physical Disk - Disk Transfers/sec:
This counter monitors the number of read/write operations being performed on the disk. SQL data access is typically random access, which is usually slower due to the need to move the drive head etc. Check that this value is below the maximum value rated by your disk drive (typically 100/sec).
Counters to examine processor performance and pressure
The following counters are available to help diagnose problems with the system processor/CPU.
Processor - % Privileged Time
Processor time under windows is split into User mode and Privileged (Kernel) mode processing. All disk access and I/O is done under Kernel mode. If this counter is greater than 25%, then the system is likely to be doing too much I/O. This value should typically be between 5% and 10%.
Processor - % Processor Time
This counter monitors the overall CPU utilisation. This value should not regularly exceed 75%, and any value over 90% is cause for concern. The CPU is used for all activity in the system, so a high value here does not automatically indicate a CPU bottleneck. Check if the disk or memory counters indicate a problem with those systems first. However if those counters are low and the CPU is still overloaded, a CPU upgrade might be recommended.
SQL Server: SQL Statistics - SQL Compilations/sec
This counter shows the number of queries that are being compiled into usable form. This can be very high during start-up and warm-up phases of SQL, but should reduce and stabilise over time. A value above 100 should be cause for concern here.
SQL Server: SQL Statistics - SQL Recompilations/sec
This counter shows the number of queries that are being recompiled. A high number here will stress the CPU.
Counters to examine network performance and pressure
The following counters are available to help diagnose problems with the network.
If multiple network cards are being used, select the card that SQL is using as the category instance (or add multiple instances if SQL is using multiple cards). The network is not often the cause of bottlenecks but some counters are available to examine network usage.
Network Interface - Bytes Total/sec
This shows the total amount of traffic being passed through the network card. During typical use, the average should not exceed 50% of the capacity of the card, to allow for spikes in demand. If this value is high but processor and memory usage are low-medium, then the network speed may be an issue.
Network Segment - % Net Utilisation
This value indicates the percentage of available bandwidth being used by the network segment. The threshold depends on the type of network being used. For Ethernet networks using a hub (not recommended), 30% is the recommended threshold for a dedicated server. For Ethernet on a switched, full duplex network, values up to 80% are acceptable, allowing room for spikes in demand.
Monitor internal service statistics
Patriot is capable of generating some statistics about internal operations inside the services. Please consult the Performance Counters document for more information on ensuring this is enabled.
Command messages/sec
This shows the number of command messages that are being passed internally between the data service, task service, and clients etc. This includes diagnostic/debug information (such as task raw data) and other internal commands.
Pending Attends count
The number of outstanding attends active in the system (new and on-hold alarms only). This could be monitored over time to see how operators are keeping up with signal traffic.
RecSig Queue Length
The number of raw signals received by the system which are still waiting for processing and logging. This is a good indication of whether the Patriot server is able to keep up with the number of signals that are arriving at the monitoring station. Generally this number should be quite low.
Signals Logged/sec
The number of signals processed and logged by the system each second. This is not the number of signals arriving per second, only the ones that have been processed by the system and placed in the signal browse and/or activation list.
Performance Audit Report
Run the performance log for a typical 24 hour period, then record the statistics in the tables below. Save this report for your records and compare to past reports. The log can also be sent to Patriot Support for analysis if any areas need further investigation or you are unsure about any of the readings.
General Information
| Check | Notes |
|---|---|
| Company Name | |
| Date | |
| Number of client accounts in use | |
| Number of workstations connected | |
| Patriot Archiving settings | |
| CPU Model | |
| Physical RAM Total | |
| Total HDD Space | |
| RAID Level and hardware/software | |
| Drives per array in RAID | |
| Type and quantity of disk controllers | |
| Disk file allocation size, stripe size, sector offset (optional, if known) | |
| Operating system drive letter and free space | |
| Patriot_Data file size, host drive and free space | |
| Patriot_Log file size, host drive and free space | |
| Archive_Data size, host file drive and free space | |
| Archive_Log size, host file drive and free space | |
| Backup drive and free space | |
| Tempdb drive and free space | |
| Network speed (switched or hub?) | |
| Shared Server or Dedicated SQL? |
Memory Counters
| Category | Counter | Minimum | Maximum | Average |
|---|---|---|---|---|
| Memory | Available Bytes | |||
| Memory | Pages/sec | |||
| Process (sql server instance) | Private Bytes | |||
| SQL Server: Buffer Manager | Buffer Cache Hit Ratio | |||
| SQL Server: Buffer Manager | Free Pages | |||
| SQL Server: Buffer Manager | Page Life Expectancy | |||
| SQL Server: Memory Manager | Memory Grants Pending | |||
| SQL Server: Memory Manager | Target Server Memory | |||
| SQL Server: Memory Manager | Total Server Memory |
Disk Counters
For Physical Disk counters, create one for each drive being used by SQL (e.g. Data files, Log files, tempdb etc.)
| Category | Counter | Minimum | Maximum | Average |
|---|---|---|---|---|
| Physical Disk 1 | % Disk Time | |||
| Physical Disk 1 | Avg Disk sec/read | |||
| Physical Disk 1 | Avg Disk sec/write | |||
| Physical Disk 1 | Avg. Disk Queue Length | |||
| Physical Disk 1 | Current Disk Queue Length | |||
| Physical Disk 1 | Disk Bytes/sec | |||
| Physical Disk 1 | Disk Transfers/sec | |||
| Physical Disk 2 | % Disk Time | |||
| Physical Disk 2 | Avg Disk sec/read | |||
| Physical Disk 2 | Avg Disk sec/write | |||
| Physical Disk 2 | Avg. Disk Queue Length | |||
| Physical Disk 2 | Current Disk Queue Length | |||
| Physical Disk 2 | Disk Bytes/sec | |||
| Physical Disk 2 | Disk Transfers/sec | |||
| Physical Disk 3 | % Disk Time | |||
| Physical Disk 3 | Avg Disk sec/read | |||
| Physical Disk 3 | Avg Disk sec/write | |||
| Physical Disk 3 | Avg. Disk Queue Length | |||
| Physical Disk 3 | Current Disk Queue Length | |||
| Physical Disk 3 | Disk Bytes/sec | |||
| Physical Disk 3 | Disk Transfers/sec | |||
| Physical Disk 4 | % Disk Time | |||
| Physical Disk 4 | Avg Disk sec/read | |||
| Physical Disk 4 | Avg Disk sec/write | |||
| Physical Disk 4 | Avg. Disk Queue Length | |||
| Physical Disk 4 | Current Disk Queue Length | |||
| Physical Disk 4 | Disk Bytes/sec | |||
| Physical Disk 4 | Disk Transfers/sec | |||
| Physical Disk 5 | % Disk Time | |||
| Physical Disk 5 | Avg Disk sec/read | |||
| Physical Disk 5 | Avg Disk sec/write | |||
| Physical Disk 5 | Avg. Disk Queue Length | |||
| Physical Disk 5 | Current Disk Queue Length | |||
| Physical Disk 5 | Disk Bytes/sec | |||
| Physical Disk 5 | Disk Transfers/sec | |||
| Physical Disk 6 | % Disk Time | |||
| Physical Disk 6 | Avg Disk sec/read | |||
| Physical Disk 6 | Avg Disk sec/write | |||
| Physical Disk 6 | Avg. Disk Queue Length | |||
| Physical Disk 6 | Current Disk Queue Length | |||
| Physical Disk 6 | Disk Bytes/sec | |||
| Physical Disk 6 | Disk Transfers/sec |
Processor Counters
| Category | Counter | Minimum | Maximum | Average |
|---|---|---|---|---|
| Processor (Total) | % Privileged Time | |||
| Processor (Total) | % Processor Time | |||
| SQL Server: SQL Statistics | Batch Requests / sec | |||
| SQL Server: SQL Statistics | SQL Compilations / sec | |||
| SQL Server: SQL Statistics | SQL Recompilations / sec | |||
| System | Context Switches / sec | |||
| System | Processor Queue Length |
Network Counters
| Category | Counter | Minimum | Maximum | Average |
|---|---|---|---|---|
| Network Interface | Bytes Total/sec | |||
| Network Segment | % Net Utilisation |
Patriot Internal Counters
| Category | Counter | Minimum | Maximum | Average |
|---|---|---|---|---|
| PatriotDataService | Command messages/sec | |||
| PatriotDataService | Pending Attends count | |||
| PatriotDataService | RecSig Queue Length | |||
| PatriotDataService | Signals Logged/sec |
SQL Query Monitoring
At times you may want to diagnose problems you suspect could be caused by troublesome or poorly running SQL queries. The follow tools and procedures will assist in this regard,
Recent Expensive queries
SQL Management Studio has built in support for a display of recent expensive queries. If you are trouble shooting a performance problem which is currently happening, this is a good diagnostic tool to run.
From Management Studio, right click on the SQL Server name from the Object Explorer view, and select Activity Monitor. Then expand Recent Expensive queries.
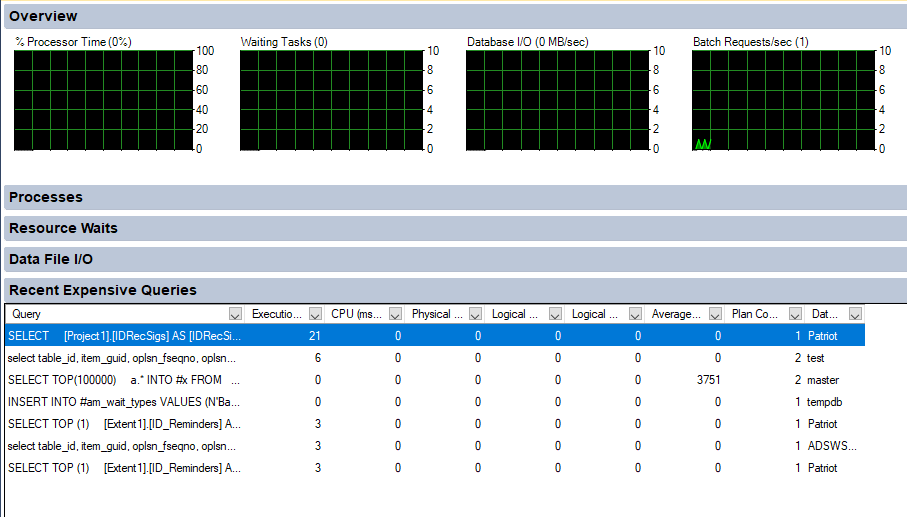
Not all queries displayed are necessarily poor performing, but could be worth further investigation. Take a copy of the content of the Query column of any queries that look suspicious.
WhoIsActive
A very useful freely available stored procedure for identifying performance issues is sp_WhoIsActive. This can be downloaded from http://whoisactive.com. Once installed, it can be run simply by executing the following query,
exec sp_WhoIsActive
A large number of entries with wait_info content can be an indication of tempDB contention issues.
The tempdb_allocations and tempdb_current columns can be used to identify queries making excessive use of the tempdb database.
It can also be a good idea to setup a batch job to automatically run sp_whoisactive, and record the results into a table. This allows for review of activity after a problem has occurred. An example of how to set this up is detailed here. Make sure that the Patriot database is not used to store the results. Create a new database for this purpose.
Alternatively if you don't want to record the results into a table, you can export the results into csv files. This can be done either manually or automatically in combination with scheduled task and performance monitoring. The following section explains how to setup a scheduled task to export the results into csv files when sqlserver process logs a high disk write rate.
Log WhoIsActive on SQL High Write Rate
Create batch file to run WhoIsActive
Create a folder in C: drive[1] and name it as WhoIsActiveOutput.
Create a text file in the folder and name it as run_WhoIsActive. Edit the file and paste the following text into it:
exec sp_WhoIsActive
Save the file and change the filename extension from .txt to .sql
Create a text file in the folder and name it as export_WhoIsActive. Edit the file and paste the following text into it:
sqlcmd.exe -S _<server>_ -d Patriot -i "C:\WhoIsActiveOutput\run_WhoIsActive.sql" -o "C:\WhoIsActiveOutput\WhoIsActiveResult.txt" _<auth>_ -s "," -W
cd "C:\WhoIsActiveOutput\"
ren WhoIsActiveResult.txt WhoIsActiveResult_%date:~0,2%-%date:~3,2%-%date:~6,4%_%time:~0,2%%time:~3,2%%time:~6,5%.csv[2]
exit
Replace <server> with your server name where SQL is running.
Replace <auth> with SQL authentication details. For Windows Authentication, enter -E. For SQL authentication, enter -U _<username>_ -P _<password>_
E.g.
sqlcmd.exe -S patserver01 -d Patriot -i "C:\WhoIsActiveOutput\run_WhoIsActive.sql" -o "C:\WhoIsActiveOutput\WhoIsActiveResult.txt" -U sa -P password123 -s "," -W
cd "C:\WhoIsActiveOutput\"
ren WhoIsActiveResult.txt WhoIsActiveResult_%date:~0,2%-%date:~3,2%-%date:~6,4%_%time:~0,2%%time:~3,2%%time:~6,5%.csv
exit
OR
sqlcmd.exe -S localhost -d Patriot -i "C:\WhoIsActiveOutput\run_WhoIsActive.sql" -o "C:\WhoIsActiveOutput\WhoIsActiveResult.txt" -E -s "," -W
cd "C:\WhoIsActiveOutput\"
ren WhoIsActiveResult.txt WhoIsActiveResult_%date:~0,2%-%date:~3,2%-%date:~6,4%_%time:~0,2%%time:~3,2%%time:~6,5%.csv
exit
[1]: If you create WhoIsActiveOutput folder in a different directory rather than C: drive, you will need to replace the path in the above text.
[2]: The output file name might have different format depending on the system date time format settings.
Once you finish editing the text file, save it and change the filename extension from .txt to .bat.
Setup a scheduled task
First, open the Windows Task Scheduler, from Windows Control Panel > Administrative Tools > Task Scheduler.
Select Action > Create Task.
Enter an easy name, e.g. Run WhoIsActive
On the actions tab, add a new action:
Action: Start a program.
Program: Click on Browse... button and navigate to the WhoIsActiveOutput folder you just created. Select export_WhoIsActive.bat
Click OK to save the task.
Create Data Collector Set
Open the Windows Performance Monitor (Windows Control Panel > Administrative Tools > Performance Monitor).
Navigate to Data Collector Sets, User Defined. Select Action > New > Data Collector Set
Select an easy name, e.g. SQL Write Rate Alerts, and select to Create manually.
Select Performance Counter Alert as the data type. Then next.
In the Add counters dialogue box, expand Process and select IO Write Bytes/sec. In the Instances of selected object list, select sqlservr.
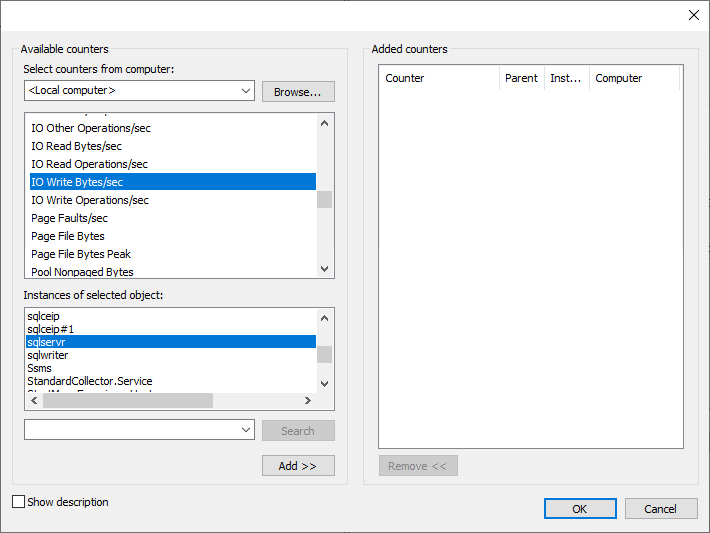
Add the counter and set the alert limit to Above 100000000. It will be triggered once the SQL write IO goes above 100MBytes/sec. You can change it to a proper value.
Click Finish, then view the properties for your new collector.
On the Alerts tab, change the Sample Interval to a proper time. The default value should work in most cases.
On the Alert Task tab, enter the name of the Scheduled Task you created above for Run this task when an alert is triggered, e.g. Run WhoIsActive
Click OK to save the collector.
Start Collector and Run Automatically
Once all alerts and counters are configured, you can start the collector set by selecting Action > Start. You should see the icon change to show that the collector is running.
Next, return to the Task Scheduler. Under the View menu, ensure Show Hidden Tasks is enabled. Now select Task Scheduler Library > Microsoft > Windows > PLA. You should see your SQL Write Rate Alerts data collector set shown.
Enter the properties for this set, and select the Triggers tab.
Now, add a new trigger. Select At Startup and click OK.
The data collector will now start up automatically when the server is started, to ensure that alert monitoring is running correctly.
Testing the alerts
The easiest way to test is to edit the alert data collector, and decrease the alert threshold, e.g. changing the value to 1000. It should generate a text file in C:\WhoIsActiveOutput folder after a while. The file name should look like WhoIsActiveResult_25-03-2019_171608.07.csv. Remember to return the alert threshold to normal after testing is complete.
View outputs
Every time the alert is triggered, it will output a csv file into the folder you created above.
TempDB Contention
Along with using WhoIsActive, as mentioned above, the following query will list any current locking contention on the tempdb database,
SELECT

[owt].[session_id],

[owt].[exec_context_id],

[owt].[wait_duration_ms],

[owt].[wait_type],

[owt].[blocking_session_id],

[owt].[resource_description],

CASE [owt].[wait_type]

WHEN N'CXPACKET' THEN

RIGHT ([owt].[resource_description],

CHARINDEX (N'=', REVERSE ([owt].[resource_description])) - 1)

ELSE NULL

END AS [Node ID],

[es].[program_name],

[est].text,

[er].[database_id],

[eqp].[query_plan],

[er].[cpu_time]

FROM sys.dm_os_waiting_tasks [owt]

INNER JOIN sys.dm_exec_sessions [es] ON

[owt].[session_id] = [es].[session_id]

INNER JOIN sys.dm_exec_requests [er] ON

[es].[session_id] = [er].[session_id]

OUTER APPLY sys.dm_exec_sql_text ([er].[sql_handle]) [est]

OUTER APPLY sys.dm_exec_query_plan ([er].[plan_handle]) [eqp]

WHERE

[es].[is_user_process] = 1

ORDER BY

[owt].[session_id],

[owt].[exec_context_id];

GO
This post provides more info on TempDB maintenance and optimization.
Enabling SQL Query Store
Introduced in SQL Server 2016, the Query Store is a powerful tool for capturing and managing query performance data. Enabling it allows you to gather valuable insights into query behaviour, execution plans, tracking impact of index maintenance and overall performance metrics.
Recommended Upgrade Workflow: https://learn.microsoft.com/en-us/sql/relational-databases/performance/query-store-usage-scenarios?view=sql-server-ver16#CEUpgrade
How to enable Query store
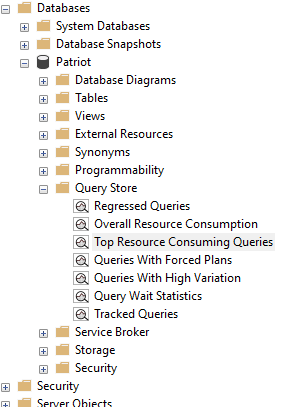
In Object Explorer, right-click a database, and then select Properties.
In the Database Properties dialog box, select the Query Store page.
In the Operation Mode (Requested) box, select Read Write.
How to monitor queries
In the Query Store tab, you will find an overview of query performance, such as the number of queries, resource usage, and wait statistics.
Click on the "Top Resource Consuming Queries" report to see a list of queries consuming the most resources.
Navigate through various reports available in the Query Store tab to analyze execution plans, query text, and other relevant details.
SQL index maintenance
Index fragmentation and page density
Over time the modifications can cause the data in the index to become scattered in the database (fragmented). For queries that read many pages using full or range index scans, heavily fragmented indexes can degrade query performance because additional I/O may be required to read the data required by the query.
For further details, refer to the Microsoft SQL page: https://learn.microsoft.com/en-us/sql/relational-databases/indexes/reorganize-and-rebuild-indexes?view=sql-server-ver16#concepts-index-fragmentation-and-page-density
Checking for index fragmentation can use a fair amount of resources, especially in big databases. It's a good idea to run it during times when the system is less busy, like off-peak hours or according to your regular database maintenance schedule.
Here's an example SQL query that demonstrates how to check for index fragmentation and page density:
SELECT
    OBJECT_NAME(i.object_id) AS TableName,
    i.name AS IndexName,
    i.type_desc AS IndexType,
    u.user_seeks,
    u.user_scans,
    u.user_lookups,
    u.user_updates,
    p.avg_fragmentation_in_percent,
    p.avg_page_space_used_in_percent
FROM sys.dm_db_index_usage_stats u
INNER JOIN sys.indexes i ON u.object_id = i.object_id AND u.index_id = i.index_id
OUTER APPLY sys.dm_db_index_physical_stats(DB_ID(), i.object_id, i.index_id, NULL, 'SAMPLED') p
WHERE p.avg_fragmentation_in_percent > 90; -- adjust the fragmentation threshold as needed
Reorganize and Rebuild
To mitigate index fragmentation, regular maintenance tasks such as index reorganization or rebuilding can be performed. These tasks help to optimize the index structure and improve overall database performance.
Reorganizing an index requires fewer resources compared to rebuilding. It's often a good idea to start with reorganization before considering a rebuild. For routine maintenance, periodic reorganization of indexes might suffice, reserving rebuilds for cases where more substantial improvements are necessary. Index rebuilds are more thorough and can be beneficial in addressing significant fragmentation or when statistics need a comprehensive update.
It's important to note that even reorganizing an index consumes resources. It's advisable to perform such operations when the system is less busy. According to SQL documentation, both reorganizing and rebuilding indexes use a considerable amount of resources, resulting in increased CPU usage, memory usage, and storage I/O.
Using SQL Server Management Studio, you can alleviate fragmentation by following the steps below.
• In SQL Server Management Studio, navigate to Object Explorer and open the desired database and table.
• Right-click on the fragmented index, and choose either the "REORGANIZE" or "REBUILD" option.
• Click "OK" to proceed with the selected operation.
Please note that SQL Server will execute the operation, but it may necessitate a period of locking during the process, leading to temporary unavailability of the index.
Enable periodic database statistics updates
Rebuilding statistics offers a simpler alternative that often provides similar benefits to manually managing indexes. Our system includes an automatic feature for rebuilding database statistics to help the SQL Server Query Optimizer to run more efficient queries.