Browse Signals
The Signals window enables you to quickly browse all the signals received. You are able to quickly move through the signals or jump to a related window. Alarm signals are highlighted in color depending on priority. See Action Plans for more information.
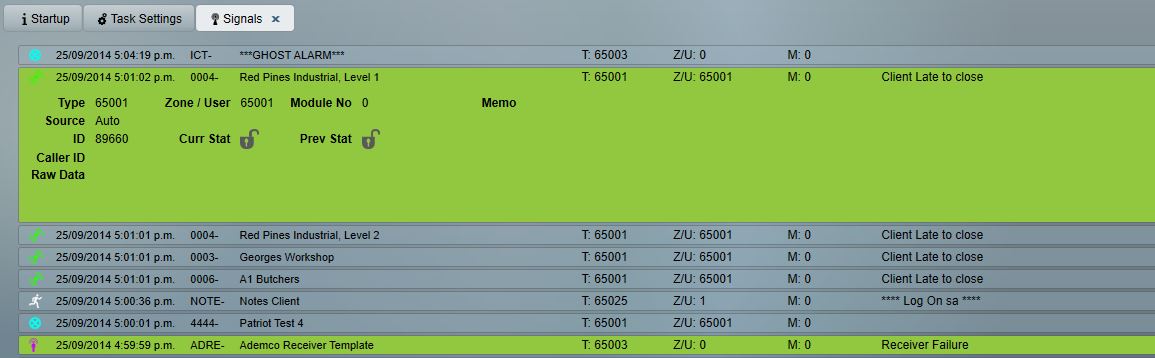
Signals Window
The signals window shows:
- Time of the signal.
- Client number and name.
- A description of the signal. (Assuming one has been entered for that type, see Event Types)
- The type of Action Plan used.
- Signal Type number.
- The Zone or User which the signal was received from
- The module number, if applicable, for this alarm format
- Any extra information about the signal, listed as memo
- Source shows the format the signal was received in, e.g. CID (Contact ID). Signals internally generated by Patriot will be displayed as Auto. Manually entered signals created by the operator will be displayed as Manual in this field.
- Raw data of the event.
- Auto number gives each signal a unique identification number. This number is useful when determining how many signals to keep in the current data before being archived.
- Current and Previous shows the status of the client as set (S) or unset (U)
- If the signal is an Operator Note then the relevant Operator name will be displayed
The format of the Signal Time along with other fields using Date/Time format will read the time format configured in Windows OS from main server. If you wish to change the format or use 24 hour time, this will need to be configured via Control Panel.
View Selected Client
For any signal received, you can quickly view the client record by double clicking the related signal. The client record will show detailed information about the clients' address, panel, open/close times, signal types, users, dispatch details and other useful client information. The scrollbar will keep your current position in the list.
Signal Menu Controls
In the bottom left of the Signals menu there is an array of options allowing you to control how you view the client signal history.

Auto Refresh
 Auto Refreshing Toggle
The Auto Refreshing toggle is intended to assist signal selection during busy periods when, if a scroll occurs as the operator is about to select a signal (e.g. for viewing of a client record the wrong signal may be inadvertently selected). When Auto Refreshing is turned on the icon will have a green light (shown), when turned off i.e. screen will not scroll, the light will change to red.
The scrollbar will always stay at the current position when new signals arrive. For Instance, if you're at the top, when new signals come in, it will scroll up automatically, so you'll see the new items (the scrollbar position won't move).
Entering Manual Signals
 Add Manual Signal
The Insert button enables the operator to manually enter a signal. Normally this is only done for testing or troubleshooting purposes.
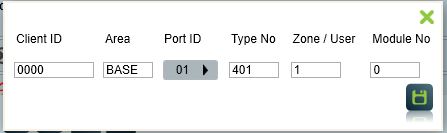
Fill out each field. Client ID, Area, and Port ID all need to match up with the client account you are trying to add a manual signal for.
 Save
Save
Click the save button to generate the signal.
If the client has an interpreter set (Advanced page of the client), the type and zone number entered here will be altered by the interpreter._ _E.g. If a client file has the Signal interpreter set to one of the 4X2 formats, the signal will be interpreted as a binary number (a byte).
Searching Signals
 Search Signals
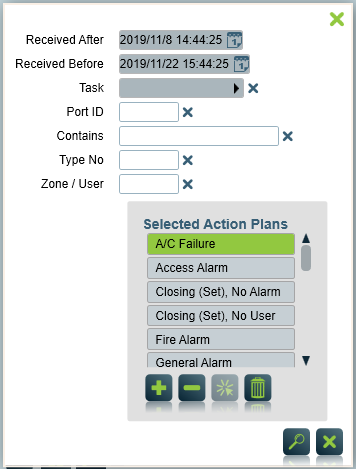
The Search Signals button allows the operator to search the active list of signals for specific information. This is useful when you need to find specific signals in the recent history, such as if you have received a signal from a specific task while testing if it is connected.
Basic View and Full View

 View Modes
The two View Mode buttons allow you to switch between showing all of the information of a signal and showing a more basic faster view that only includes the Time Received, Client No, Client Name, Description of the signal, Type No, Source, ID, and Operator (if it is an Operator Note)
Show Operator Notes
Choose whether to show operator notes in the signal list.